Skip links

Our Trackable Business Intelligence (BI)

Businesses can gain comprehensive oversight of sales, inventory levels, and staff performance via a centralized dashboard, accessible seamlessly from any location, at any time. Whether seeking a holistic overview of business operations or delving into granular details, access lightning-fast business intelligence to procure all necessary information promptly

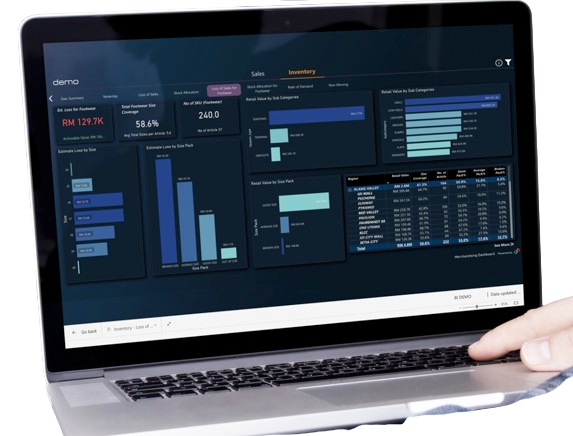
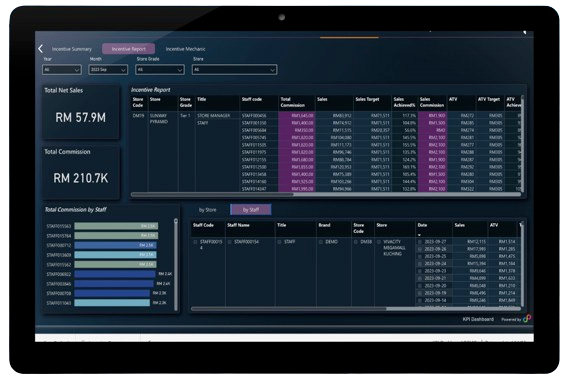
Unlock the Power of Business Intelligence for your Business

Harness the transformative potential of business intelligence (BI) to gain invaluable insights into your operations, enabling data-driven decision-making that fosters growth, enhances productivity, and drives competitive advantage

Data Integration and Consolidation

Consolidate data from disparate sources, including internal systems, external databases, and third-party applications. Aggregating data in a centralized data warehouse ensures data consistency, accuracy, and accessibility, laying the foundation for meaning insights

Infrastructure
Preparation

Prioritizing infrastructure setup is essential for the success of BI initiatives. A solid foundation for BI is when you have a robust data warehousing, ETL processes, and data quality management that will accelerate the extraction of insights, making the entire process more efficient and effective.

Visualization and
Reporting

Transform raw data into actionable insights once the preparation is set. Intuitive BI presentation tools like Microsoft BI can create compelling visualizations, customized reports, and dynamic dashboards that empowers stakeholder at all levels in your organization to make data-driven decisions quickly and confidently.

Trackable is an end-to-end integrated BI solution

Retail Dashboards: Simplifying Insights

  • Retail dashboards simplify intricate data to provide actionable insights.

  • Executives monitor trends, pinpoint areas for enhancement, and oversee operational changes.

  • Familiarity with different dashboard varieties assists leaders in choosing customized solutions to meet specific requirements.

Historical Analysis / Past View

  • Comparison by 2 selective periods
  • By regions
  • By category / Season
  • New Product Speed-to-market
  • New Product Performance
  • Ranking with S-o-H

Simplifying Period-to-Period Sales Analysis

  • Insightful Comparison: Analyzing two sales periods illuminates growth and performance
  • Identify Differences: Spot disparities in store performance, sales trends, and overall business metrics
  • Quick Decision-Making: Swiftly discern shifts, successes, and improvement areas
  • Strategic Enhancements: Utilize findings for targeted improvements, fostering sustained growth

New Product Launch Key Metrics for Success

Distribution Metrics
  • Retail Presence: Measure the number of stores stocking the new product to assess reach.
  • Geographic Reach: Analyze the product’s availability in targeted markets to gauge penetration.
Sales Performance Metrics
  • Sales Volume: Track the total revenue or units sold to evaluate initial success.
  • Sell-Through Rate: Assess the rate at which inventory is sold to gauge demand and market acceptance.

Retail Inventory Optimization

Gain a competitive edge by leveraging key metrics that ensure optimal inventory levels, prevent lost sales, and drive profitability.

  • Lost Sales Due to Stockouts: Estimates revenue loss due to unfulfilled customer demand because of insufficient stock
  • Inventory Turnover Rate: Helps in managing stock levels efficiently
  • Days Inventory Outstanding: Measures the average number of days stock is held before being sold.
  • Sell-Through Rate: Indicates the rate at which inventory is sold
  • Stock-to-Sales Ratio: Compares the level of inventory to sales over a specific period

Enhanced Demand Fulfillment

  • This strategic approach ensures surplus inventory finds its ideal market, reducing carrying costs while maximizing sales opportunities.
  • Strategically moving products to where demand thrives not only minimizes waste but also capitalizes on untapped potential in high-demand areas.

Maximizing Sales with Size Optimization

By implementing these strategies and maintaining a balance between inventory levels and customer demand, retailers can effectively optimize broken sizes in footwear inventory, reducing excess stock while meeting customer needs.

  • Dynamic Merchandising: Group similar sizes together to create a more balanced display. Highlight the availability of various sizes to encourage customers to explore more options.
  • Inventory Analysis: Regularly analyze sales data to identify which sizes are in high demand and which sizes linger in inventory. Adjust purchasing patterns based on this analysis to align with customer preferences.

Tailored Agreements for Unleashing Employee Potential

Redefine employee success through personalized performance agreements. Embrace a performance-driven culture that acknowledges individual strengths and unleashes potential. With Trackable’s personalized performance agreements, nurture exceptional talent and foster a workforce that consistently outperforms generic standards.

Start your journey towards retail excellence today. Lets make it Posable